USES OF POWER BI:
There is no training required to use Power BI. The reporting part is much easier. Power BI is designed to provide you with data-driven insights. Here are the uses of Microsoft Power BI:
- Reporting: Various data sources can be connected; Customized reports can be created using power BI and all the reports will be very interactive.
- Dashboard: Power BI dashboard is a collection of colorful data visuals which indicates the story through graphs and charts. The dashboard is customizable, and it contains all the key metrics and KPI’s. The visuals were represented as tile on the dashboard. Tile is nothing but snapchat of the data that is pinned to the dashboard.
- Data Integration: Power BI provides a wide range of visualizations, like line chart, scatter chart, area chart, map, filled map, stacked bar chart etc. Users can integrate data from Excel, cloud app or SQL server. Power BI has an automatic refreshing tool which helps to find new insights.
Downloading Power BI:
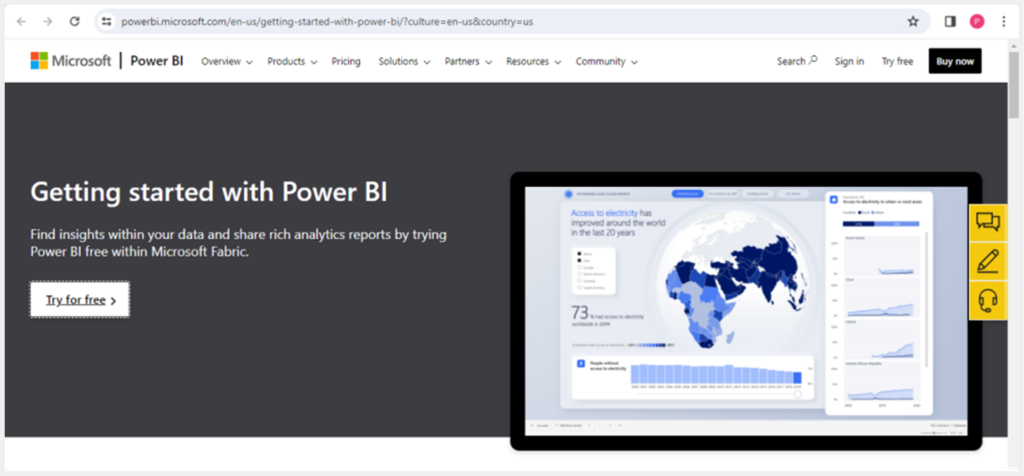
Download power BI for desktop from the official website. You will find Try for Free > power BI desktop. Initially Power BI was compatible only with Windows OS, but now it can be accessed through any OS including Mac. If you use a Mac, you must use virtual machine like azure, google cloud, or AWS.
Installation:
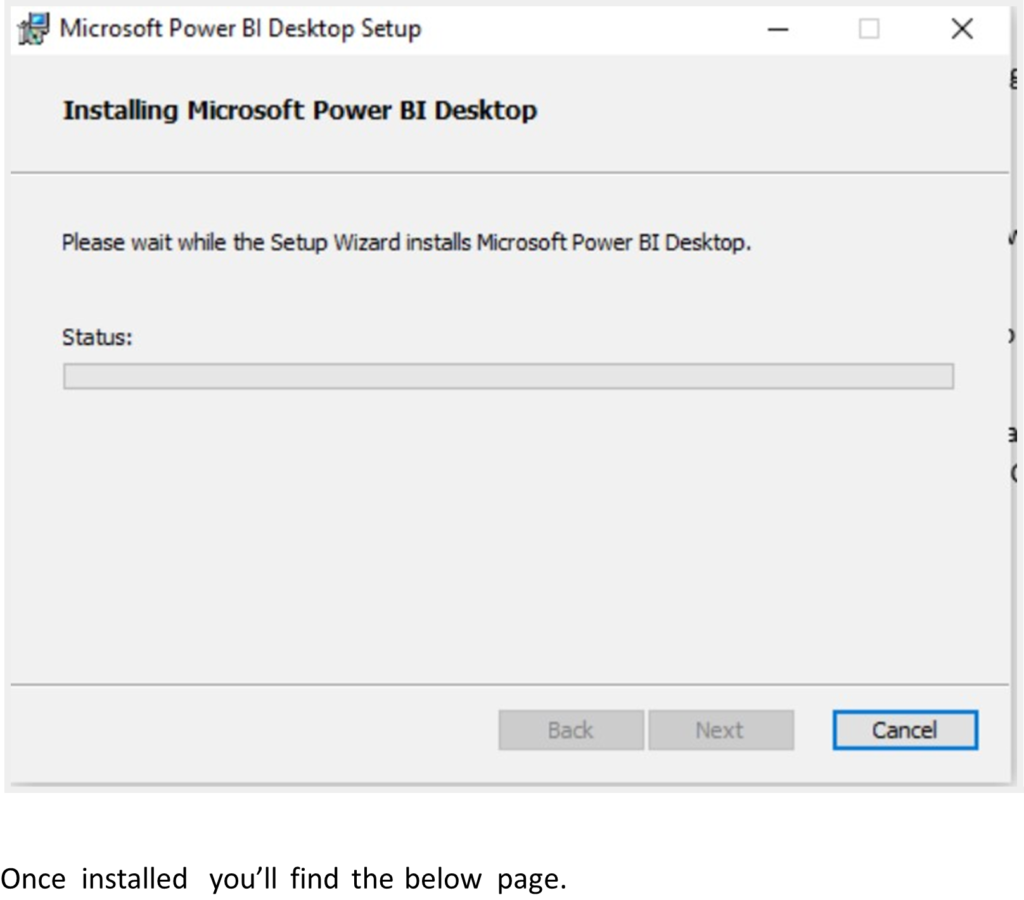
Once done with download you must install with the following steps: open file> Next> I accept terms > Choose folder > create shortcut > Install> Launch > Finish.
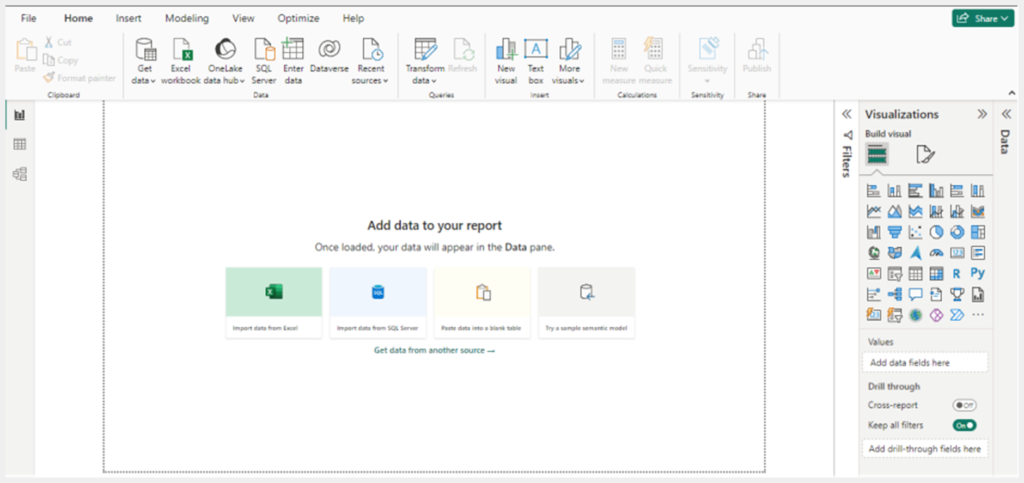
Once installed you’ll find the below page.
Importing Data:
Importing datasets will be used to build the report. You can import data from various sources like Excel, SQL Server, and cloud services. To do this, under home you’ll find “Get Data” Click on it and import an Excel sheet from a local file on your choice.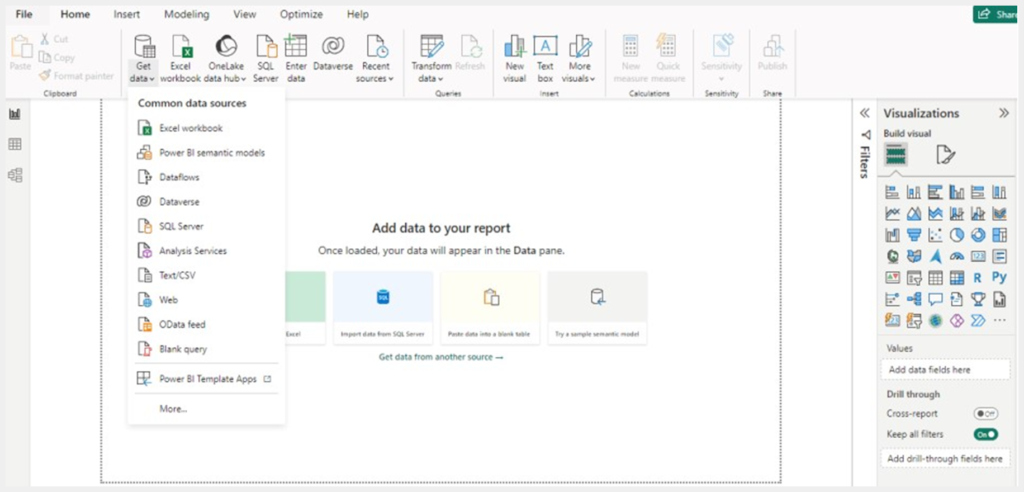
Formatting Data:
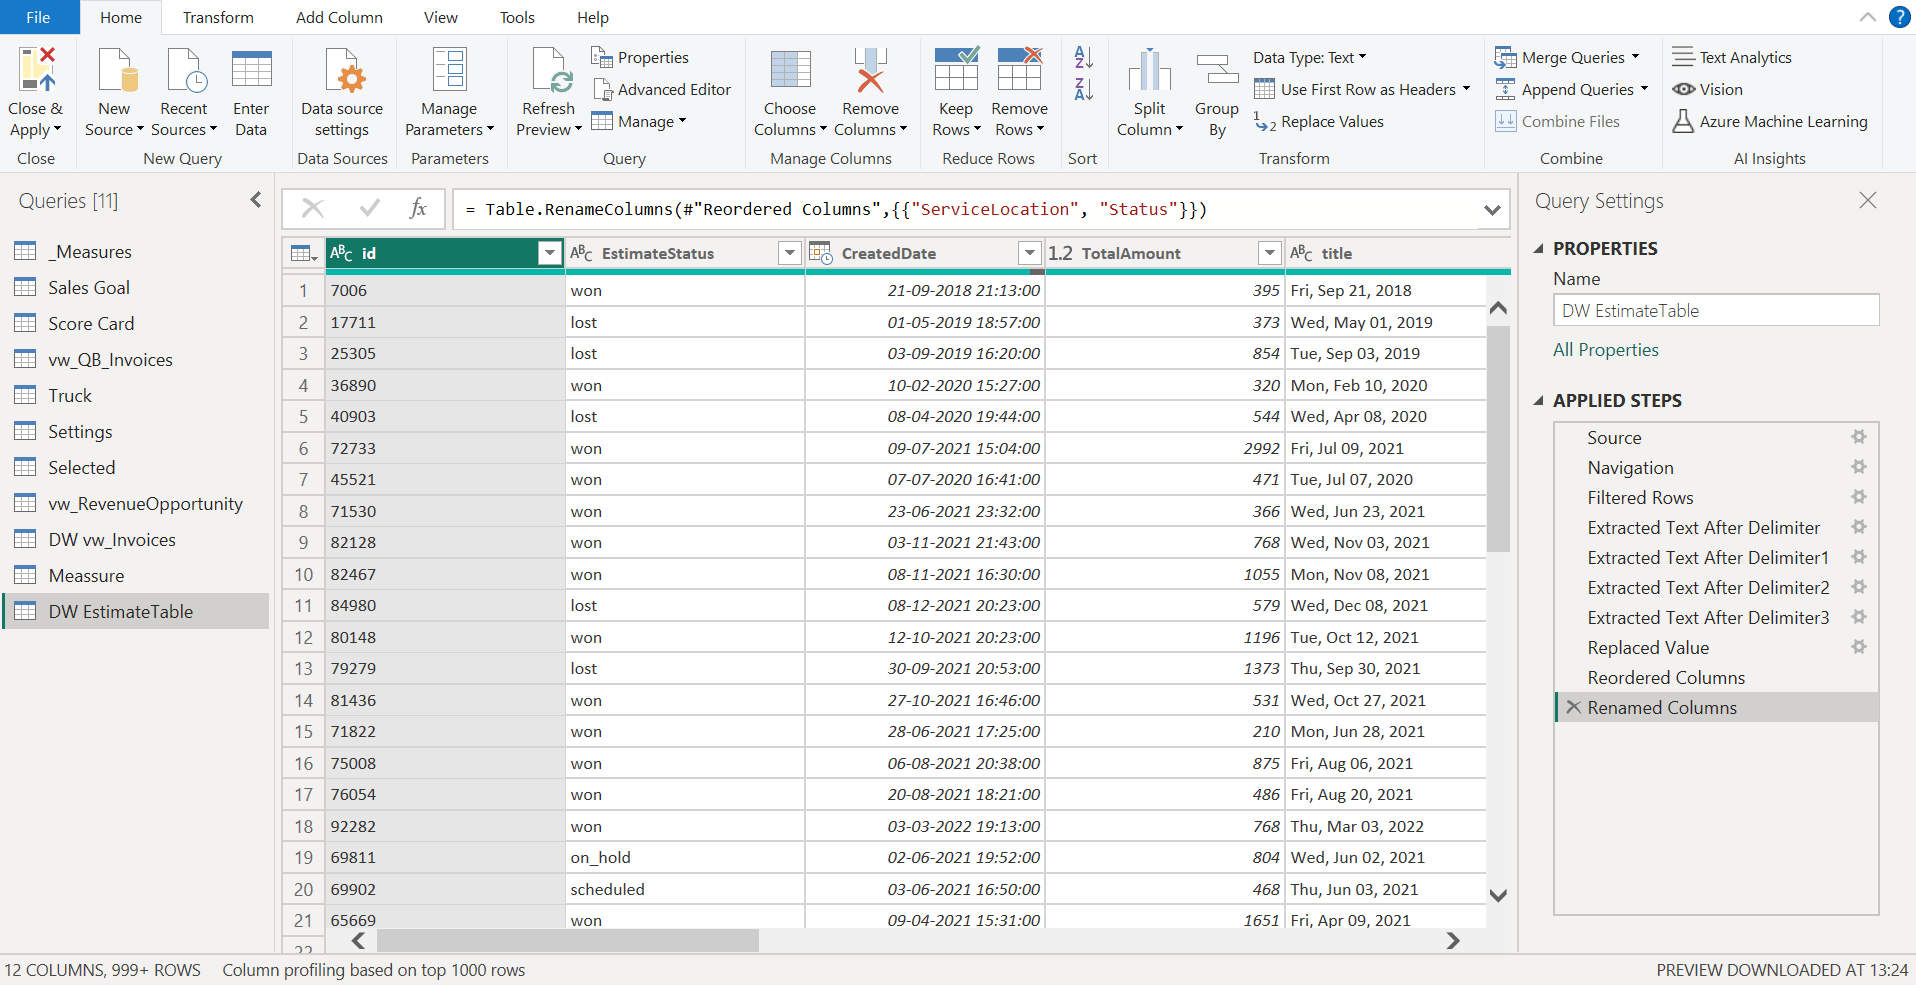
Once you finish uploading the sheet, your data will be processed from the navigator screen. Choose “Load Data” which appears below. After loading, the below screen will appear once you click on load data.
Data Visualization:
On the top bar, you have tabs like home, insert, modeling, and more. On the right side you will find Visualizations. You can start visualizing your data by using various formatting options like Stacked bar chart, Pie, donut charts, even Map. We used a Stacked column chart in this data shown below.
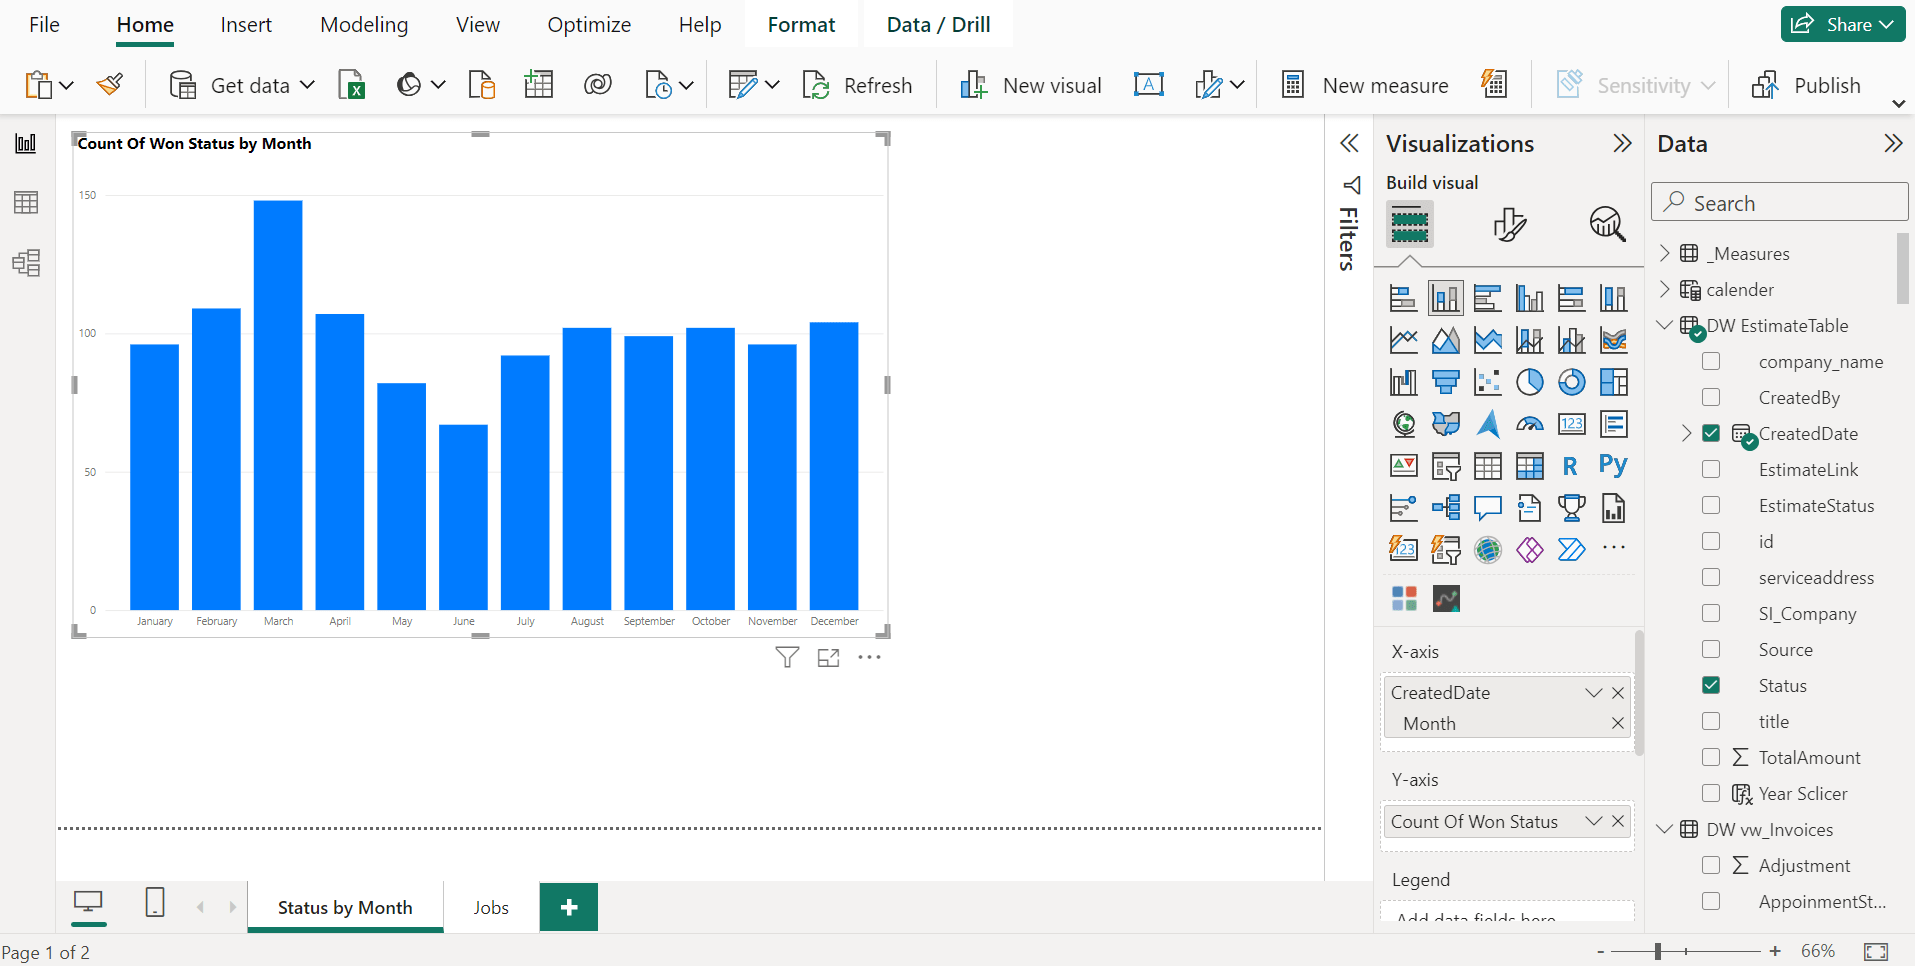
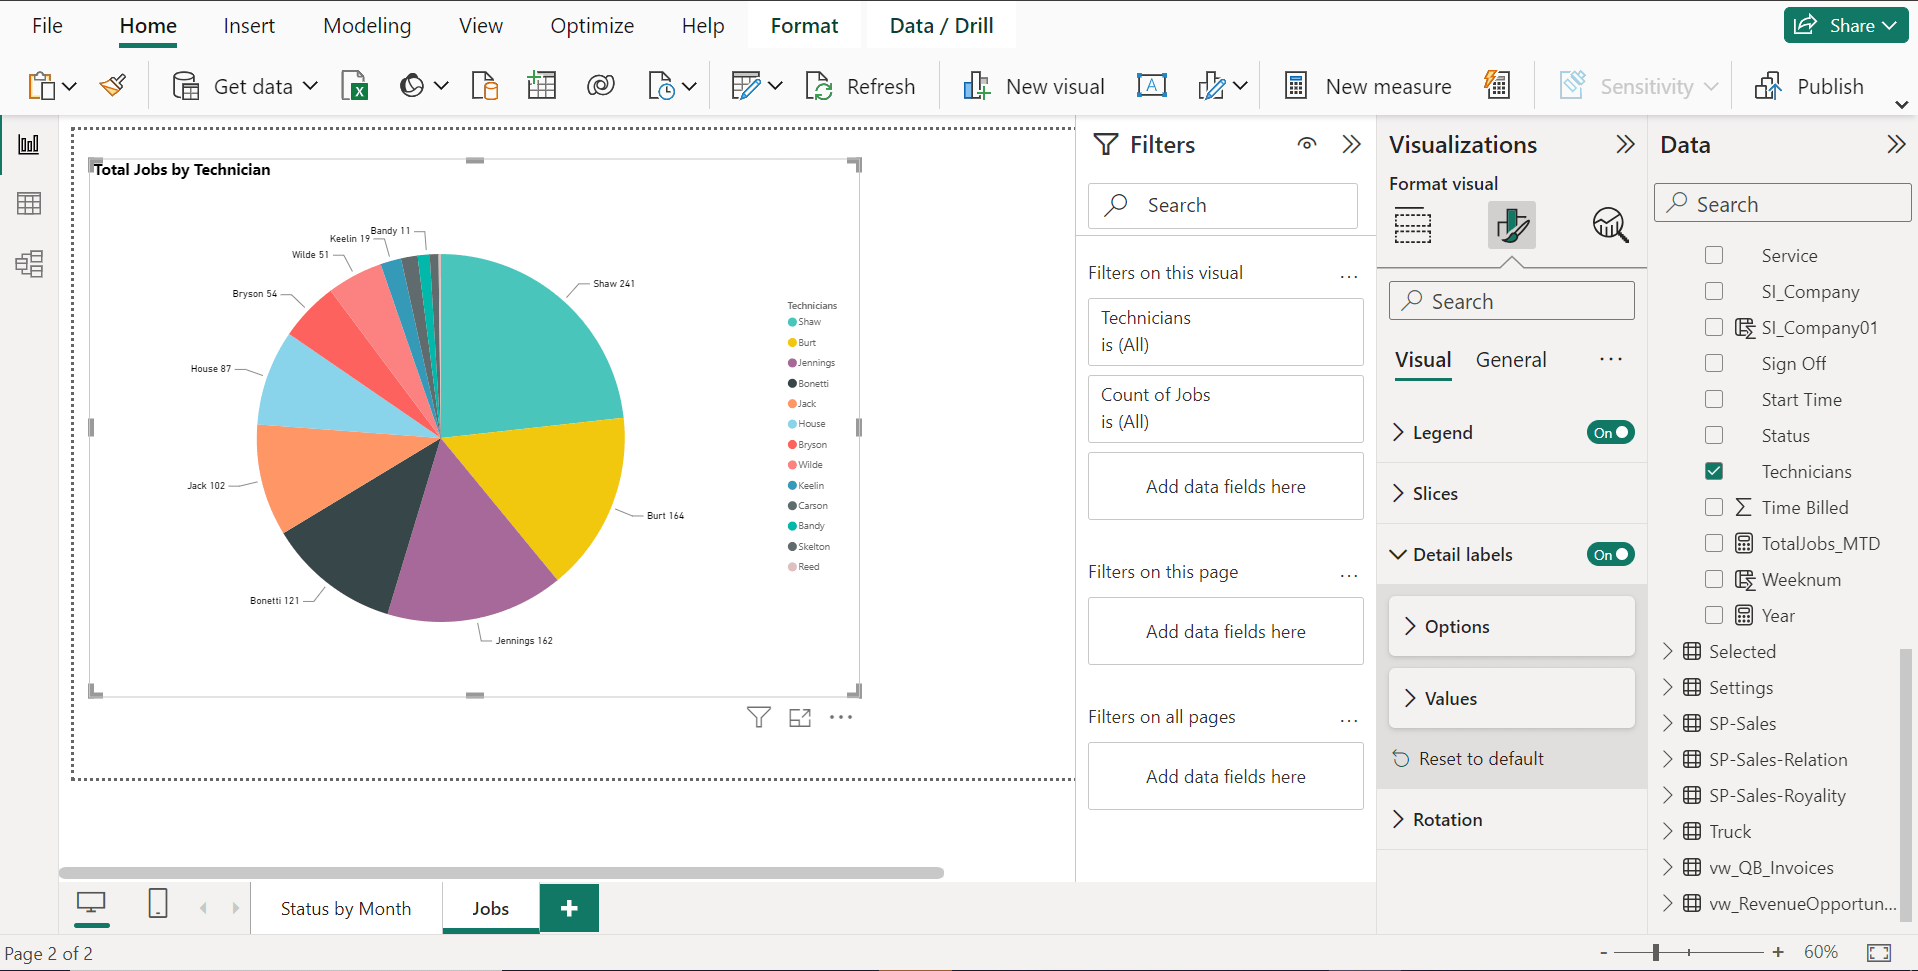
Select a chart according to your need and choose the data which you want to visualize. If you want to change the format of values you can do using the formatting option in right side column next to Filters, Data.
Conclusion:
In this article we have seen how to download and build a basic power BI dashboard. Awesome right? If you were thinking about consulting experts in Power BI, consider Signa Tech. They provide real-time based Power BI services which you can set up using the web or mobile. Signa Tech also provides cloud-based Power BI services, it offers powerful business insights, metrics and KPI’s. Data warehouse capabilities include data creation, discovery, and interactive dashboards. Signa Tech services help businesses with redesigning their data. You can check out the website for more details.
