Manufacturing Dashboard
Unlock Your Business Potential with Signatech
At Signatech, we believe that technology is more than just code and circuits—it’s the catalyst for transformation.
Our journey began with a vision: to bridge continents, connect expertise, and simplify the complex world of IT solutions.
Call us:
Manufacturing Dashboards
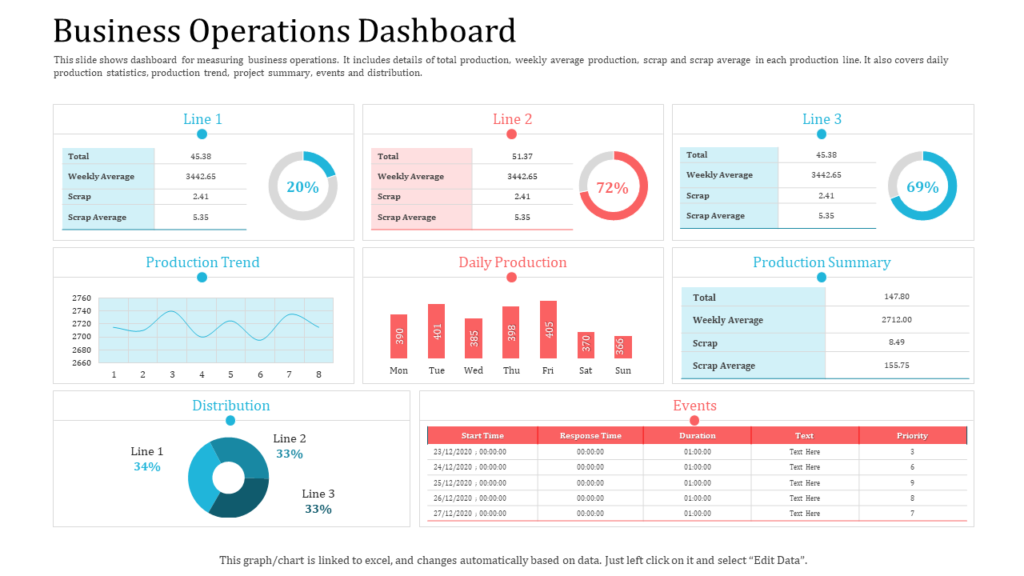
Manufacturing Dashboard is an actual appliance that gathers key information about manufacturing in an easy-to-read format.
The following is used to display all facets of operations such as sales, production, stock, and financials.
This type of work turns data into insights that allow teams to make the right decision regarding resources and production performance.

Our trusted Partners


Key Functionalities of Our Manufacturing Sales Dashboard
The powerful features of our Manufacturing Sales Dashboard are crafted to Manufacture company with essential insights and enhance their data-driven decision-making capabilities
Manufacturing Sales Dashboard
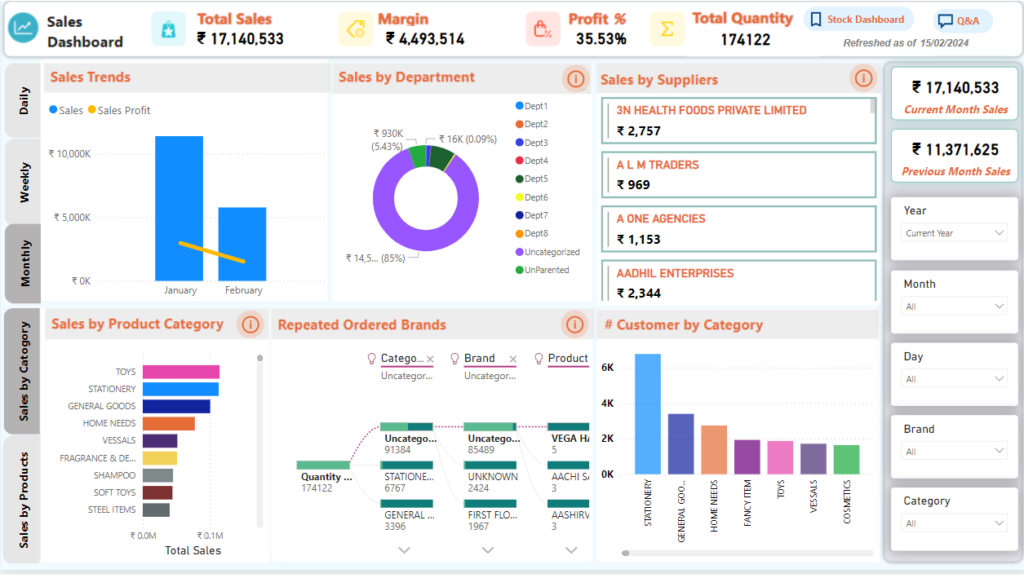
provides an opportunity to have an idea about the main results achieved in the sphere of sales. It presents year on year sales positions, showing the shipped and the pending orders for the past year.
Small and frequent shipments make it possible for the teams to determine amounts shipped and due on a daily basis, and sales data by customer on a monthly basis keeps key accounts in view.
The sales growth and profit trends are also captured in bar charts to show the cumulative shipping amounts on a daily basis to provide a month’s view in one graph.

Manufacturing Pricing Dashboard
provides information on pricing and order information with ease to track the cost and vendor orders.These are tables containing item quantities, job status, and even open jobs, as well as a list of purchase orders containing vendor information, order dates, quantities, and prices.
A bar chart captures the historical values for quantities received and a line chart captures the values of unit pricing and vendor wise values in order to get an idea about the values over time.
Other included tables offer the facility to view bill and sales details of orders shipped and those which are pending, the customers’ name, prices and profit margins by part with an option to view only the selected part.

Metzger Inventory
Inventory Dashboard gives a comprehensive view of Metzger’s inventory management by hosting vital inventory data on particular items and detailed descriptions based on their locations.
provides information on pricing and order information with ease to track the cost and vendor orders. These are tables containing item quantities, job status, and even open jobs, as well as a list of purchase orders containing vendor information, order dates, quantities, and prices.
With the help of these metrics, this dashboard assists to track inventory usage effectively across all locations and meet the needs of customers.

Financial Dashboards
The Financial Dashboard provides a snapshot of cash on hand, inventory, and key financial metrics, comparing values from the previous and current year.
It includes charts for accounts payable, receivable, year-to-date ratios, and cash flow. A quick view of "Key Financial Positions" highlights essential financials, while vendor transactions detail purchase prices, discounts, and payments.
Sales staff incentives are also displayed, tracking bonuses based on new customer sales and performance, making it easy to manage finances, vendor costs, and employee rewards.

Operations Dashboards
Events Dashboard is used to display information about announcements and other events and it is convenient for everyone to stay up to date.
It monitors the process of sales by identifying such things as actual versus target or desired sales performance indicators that show the aspects that require attention.
Besides, the dashboard displays other alerts such as the birthday of the employees in the organization which enhances the recognition of the employees. With this common ground, it becomes convenient for the teams to receive important information concerning some events and our achievements.

Commission Dashboard
The Commission Dashboard gives the details of customers’ operations, arranging them under the year and the month of the invoice. It contains details of each order, order lines, customer information, quantities invoiced, price, cost, sales price, item and product.
Commission details are summarized in a central table so that teams can have a comprehensive view of commission-related measures.
This makes it easier to monitor the sale per customer and determine how profitable a specific customer is and therefore how much commission to give out with the right figures. Besides, the dashboard displays other alerts such as the birthday of the employees in the organization which enhances the recognition of the employees.

Orders Dashboard
The Orders Dashboard presents all order information with the help of which a customer can control the status of the order progress at any point of time.
The Orders Dashboard presents all order information with the help of which a customer can control the status of the order progress at any point of time.
Some of the fields that it contains are customers name, orders date, line, item descriptions, quantities, unit price, net price, cost, and status. Further, it captures the amount shipped, invoiced, and yet to be shipped or invoiced, it consolidates all order information into one.

Customer Retention Dashboard
The Customer Retention Dashboard captures all the measures of customer loyalty with a special emphasis on the number of customers retained for the year.
It also contains information about churn rates, order values and average order frequency, broken down by orders greater than and less than $50k to accommodate analysis of high and low yielding retention.
Further, it distinguishes the revenue generated by each distribution channel and reveals some of the causes for customer churn and measures for change. A pipeline flow also represents opportunities in won, lost, or new categories to let the teams analyze the changes in customer relations efficiently.

Dashboard
