Managing inventory goes far beyond simply counting stock; it’s about making informed, proactive decisions that fuel growth and reduce waste. This is exactly where BI Reports for Inventory make a significant impact. These powerful business intelligence tools turn raw inventory data into actionable insights, enabling organizations to streamline operations, reduce holding costs, and respond swiftly to changing market demands.
Why Traditional Inventory Management Fails
Many businesses still rely on outdated methods manual spreadsheets, disconnected ERP systems, or inconsistent reporting to manage inventory. This leads to:
- Overstocking or understocking
- Delayed replenishment cycles
- Missed sales opportunities
- Increased holding and logistics costs
- Poor demand forecasting
These inefficiencies don’t just cost money they also affect customer satisfaction, delivery timelines, and overall competitiveness.
That’s why modern companies are turning to BI Reports for Inventory to overcome these challenges.
What Are BI Reports for Inventory?
BI Reports for Inventory are customized dashboards and visualizations generated by Business Intelligence (BI) tools like Power BI, Tableau, or Looker. These reports pull real-time data from multiple systems ERP, POS, warehouse, and supply chain platforms and present it in a consolidated, easy-to-understand format.
They help inventory managers, supply chain analysts, and decision-makers to:
- Track real-time inventory levels
- Monitor fast-moving and slow-moving SKUs
- Identify stock-out risks
- Forecast future demand based on historical patterns
- Analyze supplier performance and lead times
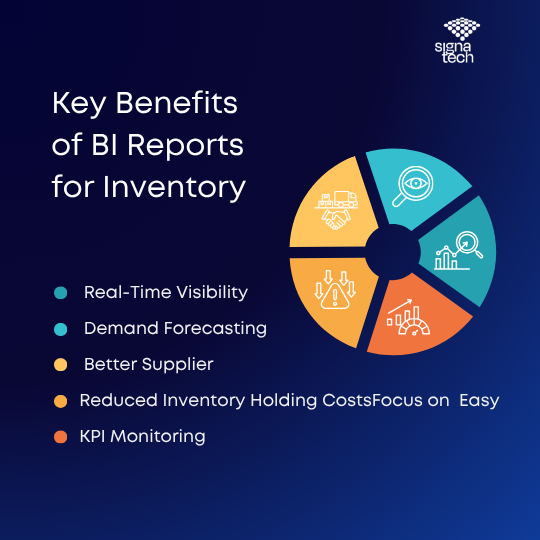
Key Benefits of BI Reports for Inventory
Here are some of the critical benefits businesses experience when they adopt BI-powered inventory dashboards:
Real-Time Visibility
BI tools provide live tracking of inventory across warehouses, stores, and channels. No more waiting for weekly Excel reports. Decision-makers get immediate insights into what’s available, what’s selling fast, and what needs urgent restocking.
Improved Demand Forecasting
Using historical sales data, seasonal trends, and even external factors like holidays or weather patterns, BI Reports for Inventory help businesses forecast demand accurately—avoiding overstocking or stockouts.
Better Supplier and Procurement Management
BI reports can analyze lead times, delivery delays, and order accuracy from different vendors. This allows procurement teams to make better supplier choices, negotiate terms, and ensure timely replenishment.
Reduced Inventory Holding Costs
By optimizing reorder points and understanding product velocity, businesses can maintain learner inventory levels freeing up cash flow and reducing storage expenses.
Easy KPI Monitoring
Whether it’s inventory turnover ratio, stock-to-sales ratio, or carrying cost of inventory, BI Reports for Inventory help managers track performance metrics effortlessly.

#image_title
Must-Have Inventory KPIs in BI Reports
When creating effective BI Reports for Inventory, it’s crucial to include the right KPIs and metrics:
- Stock Turnover Rate: How quickly inventory is sold and replaced
- Reorder Point Alerts: Highlight items nearing depletion
- Stock Aging Analysis: Identifies products staying too long in storage
- ABC Analysis: Categorizes inventory based on value and frequency
- Inventory Accuracy Rate: Compares physical counts with system data
With these KPIs on a single dashboard, teams can make fast, evidence-based decisions.
Real-World Use Case: Inventory BI in Action
Let’s consider a mid-sized retail chain that implemented BI Reports for Inventory across its 25 stores. Prior to using BI, the company frequently dealt with:
- Overstocked seasonal goods after the demand window closed
- Frequent stockouts on top-selling SKUs
- Disputes with suppliers over delayed deliveries
After switching to a BI-based system, they created real-time dashboards showing store-level inventory, daily sales trends, and supplier lead times. The result?
- A 27% reduction in overstock
- 40% fewer stockouts across all outlets
- 15% improvement in delivery SLA compliance from suppliers
That’s the power of smart reporting.
Choosing the Right BI Tool for Inventory
Not all BI tools are created equal. When selecting the right platform for building BI Reports for Inventory, look for features like:
- Integration with your existing ERP or warehouse management systems
- Customizable dashboards
- Drill-down capability for deeper insights
- Role-based access for different departments
- Real-time alerts and mobile access
Power BI, Tableau, and Google Looker are popular choices for businesses of all sizes.
Good inventory management is no longer only an operational process; it’s a strategic advantage. Using BI Reports for Inventory gives businesses visibility, agility, and control of one of their most valuable assets.
Regardless of whether you’re a manufacturer, retailer, or distributor, Business Intelligence (BI) reporting empowers you to shift from guesswork to precision, and from being reactive to proactive
In today’s hyper-competitive environment, adopting Business Intelligence services can be the difference between success and failure.
At Signatech, we specialize in helping businesses leverage BI tools to gain real-time visibility, make data-driven decisions, and stay ahead of the curve.
