In a fast-paced manufacturing environment, agility, accuracy and data-driven decisions are essential for businesses to stay ahead. Manufacturers are faced with one of their biggest challenges – the requirement for real-time visibility into their supply chain combined with the ability to forecast demand. The Signa Insights Dashboard gives you an edge right away – a visual, predictive dashboard to merge both supply chain visibility with demand forecasting to turn complicated data into actionable insights.
Let’s take a moment to examine how manufacturers can capitalize on this smart platform to promote operational excellence and enhance their supply chain performance.
- The Modern Manufacturing Challenge
Manufacturers often operate in multiple geographies, with multiple suppliers, and multiple distribution channels to their customers. Therefore, they battle with trying to answer simple, yet critical questions:
- What’s currently happening with raw materials availability?
- How many finished goods are sitting in warehouses?
- What product lines will see increased demand next month?
- How do we prevent logistic bottlenecks before they happen?
Without one single, center-of-truth system to track these variables, decisions will be made using a combination of non-integrated spreadsheets, manual reporting, and stale data; resulting in high costs of operations, production delays, and loss of revenue opportunities.
The Signa Insights Dashboard fulfills this need, putting supply chain and demand information together in a single visual, predictive dashboard.
- Unified Supply Chain Visibility and Demand Forecasting
At the center of Signa Insights is a robust integration layer that stitches together information from any ERP systems, CRM applications, supplier portals and IoT sensors.The end product is a dashboard that provides real-time visibility into the supply chain and demand forecasting, which provides:
- End-to-End Visibility: All movement will have visual tracking from the time of procurement through delivery.
- Predictive Demand Forecasting: Using artificial intelligence models to evaluate historical sales and market trends, demand will be accurately predicted.
- Anomaly Detection: Automated alerts will detect delays, excess inventory, or under-performing routes in real-time.
- Unified Tracking of Key Performance Indicators (KPIs): A single point of reference will monitor production rate, lead time, order fulfillment, and various materials.
The dashboard is fully integrated to be much more than a visual display user; the dashboard supports real-time decision-making.
- Converting Data from Static Metrics to Actionable Intelligence
Traditional dashboards just display numbers. However, the Signa Insights Dashboard will turn metrics into intelligence.
Here is how a manufacturer will demonstrate the dashboard and use it for proactive, rather than reactive, decision making;
- Predictive Inventory Planning: The AI will predict material requirements weeks in advance and aid in ensuring the manufacturer will not go over their stock levels.
- Supplier Performance Insights: The dashboard will report grades (A- F) for their suppliers based on reliability, lead times, and defect rates. As a result, many different buying or sourcing strategies would be utilized depending on the supplier performance.
- Production Synchronization: When demand spikes are predicted to occur soon, the production scheduling will auto-adjust to ensure capacity is in line with what the market needs.
- Cost Optimization: Aligning demand and supply, which will minimize unnecessary transportation and warehousing costs.
Forecasting and planning based on data will allow organizations to improve service levels and reduce waste and lead times, while utilizing historical data.Main Benefits for Manufacturers
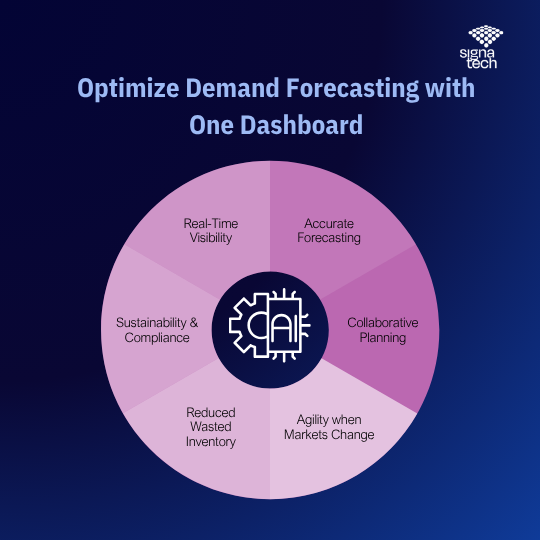
Through a single supply chain visibility and demand forecasting dashboard, manufacturers gain a measurable business impact:
- Real-Time Visibility:
Get instant visibility into raw material availability, production status, and shipment status.
- Accurate Forecasting:
Next-generation algorithms limit forecasting errors based on seasonality, regional insights, and historical data.
- Collaborative Planning:
Different functions e.g., procurement, sales, and operations share dashboards and avoid siloed decision-making.
- Agility when Markets Change:
Receive active alerts when changes in demand or supply happen to respond quickly.
- Reduced Wasted Inventory:
Synchronized supply-demand mapping reduces overproduction and minimized under-utilized assets.
- Sustainability & Compliance:
Get complete traceability to easily meet and exceed sustainability goals and obligation.
In summary, Signa Insights takes manufacturers from a static reporting environment to one of live, intelligence-based forecasting.
- Real-World Use Case Example
A mid-sized automotive parts manufacturer in South India, turned to Signa Insights to improve forecasting and supplier performance.
Before the Signa Insights dashboard:
- Monthly forecasting efforts were based on manual sales spreadsheets.
- Suppliers would often be late with raw materials due to inadequate visibility.
- The warehouse was overstocked leading to a blockage of 15% in working capital.
After signing on with Signa Insights dashboard:
- The AI models predicted order trends with 92% accuracy.
- Supplier delays decreased by 40% due to early warnings via the Signa Insights dashboard.
- The company saved ₹20 lakh annually in holding costs by managing their inventory in a lean manner.
- This example is representative of how supply chain visibility and demand-based forecasting dashboards are not just tools for data they can accelerate growth.
- Future-Ready Technology Stack
The Signa Insights Desktop dashboard is built on a cloud-based architecture leveraging advanced analytics and machine learning systems.
Key features include:
- IoT-enabled: Allows for real-time equipment monitoring and shipment tracking.
- Machine Learning Forecast Models: Models learn and adapt to improve forecasts over time.
- Power BI & Tableau Integration: Dashboards can be easily visualized and customized.
- Automated Reporting: Daily and weekly summaries are created and sent automatically to stakeholders.
- Role-based access: Dashboards can secured and specific to functions.
The system will seamlessly connect with your existing ERP e.g., SAP, Oracle, Tally to create a smooth implementation with little disruption with current work processes.
- Aligning Strategy and Real-Time Insights
The biggest advantage in competition is aligning strategy. The Signa Insights Dashboard links senior decision-making with operations execution by:
- Allowing C-level executives to monitor key performance metrics in real-time.
- Allowing operations teams to monitor real-time KPIs on a daily basis.
- Accurate forecasts providing budget planning insights for Finance teams.
- Connecting these decisions reduces the traditional gap existing between departments and creates a truly integrated manufacturing ecosystem.
Powering Predictive Manufacturing with SignaTech
The world of manufacturing is transitioning from reactive management to predictive intelligence. The Signa Insights supply chain visibility and demand forecasting dashboard allows companies to have clarity and confidence to act ahead of the market.
With SignaTech’s deep understanding of analytics, automation, and industry-specific customization, manufacturers can unlock the full extent of their data, help remove inefficiencies and be future ready.
SignaTech – smarter supply chains – smarter decisions.
Book a personalized demo today at www.signatech.com and see how the Signa Insights Dashboard can transform your manufacturing’s visibility and forecasting today.