
In the rapidly changing world of retail, the efficient management of inventory can significantly affect profitability from a retailer’s perspective. Retailers need to strive to find the right balance between having enough stock to satisfy demand and avoiding excessive stock that ties up working capital. This was where Signa Insights, a next-generation retail inventory optimization dashboard, can change the way retail chains manage their supply chain and operations.
The Problem: Proper balance of stock on hand and profitability
Most retail chains face these two issues concerning inventory inventory position:
- Excess Stock — Locks up working capital and increases carrying costs.
- Stock Outs — Lost sales, reduce customer satisfaction, and damage brand trust.
Most traditional methods of tracking stock using spreadsheets, or basic ERP systems, lack the flexibility that allows for effective monitoring of inventory dynamics across multiple stores, warehouses, and distribution centers. This is why leading retailers are beginning the move to dashboards that are data based. Signa Insights uses a combination of analytics, AI forecasting, and visual intelligence for a complete 360° view of inventory performance.
What is the Signa Insights Retail Inventory Optimization Dashboard
The Signa Insights Dashboard is an advanced analytics platform developed by SignaTech for retail businesses. It allows retail chains to track the flow of inventory, demand trends, supplier performance, and replenishment cycles in one integrated application.
Rather than static reports, the retail inventory optimization dashboard employs visualization of real-time data and AI-based forecasting to help managers to make fast, confident decisions. The Signa Insights Dashboard puts you in control of every SKU, shelf and shipment- whether your business has 5 or 500 outlets!
Significant Features of the Signa Insights Dashboard for retail Inventory Management
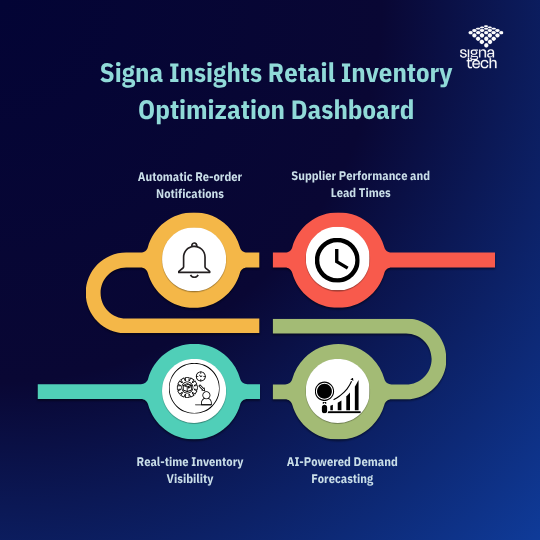
- Real-time Inventory Visibility
Immediately see store-wise stock and product-wise stock levels at one or across multiple stores.Quickly see stock aging, stock movement trends, and reorder points.
- Identify slow-moving or non-moving items and reduce shelf space.
- Monitor all transfers between warehouses and outlets in real time.
- Using real-time data from POS, ERP, and warehouse systems, decision-making can occur before situations become problematic.
2.AI-Powered Demand Forecasting
The Signa Insights dashboard uses sophisticated predictive algorithms to forecast demand based on:
- How much you sold previously
- Seasonal and promotional trends
- Weather or regional factors
- How long suppliers require to replenish stock
When the right forecasting is applied, retailers have the ability to replenish inventory accurately, avoiding having too much or not enough stock.
3.Automatic Re-order Notifications
With the dashboard, thresholds can be set on each item or should you want to classify items as being above or below average stock. Once stock declines to a ‘safe’ level, the dashboard can either send a message to the procurement team or notify the procurement team automatically. This adds:
- Consistency in product availability
- Less manual checking
- More opportunities to have everyone working together with a timely supplier
- Ultimately the automation provides everyone with more time and helps ensure you don’t run out during peak demand.
4.Supplier Performance and Lead Times
Signa Insights also tracks metrics surrounding supplier performance such as, on-time delivery, quality of product, and lead time averages.
Retailers can quickly assess weak or unreliable suppliers and adjust their reorder guidelines accordingly to ensure they are planning accordingly and keeping their supply chains flexible and resilient in market fluctuations.
5.SKU-Level Profitability Metrics
Every SKU contributes differently to the bottom lineThe retail inventory optimization dashboard indicates the following:
– High-margin products supporting profitability
– Low margin items underperforming and costing resources
– Cross-selling opportunities to enhance revenue per customer
– Connected sales velocity to profit margin will help direct promotions and stocking focus with Signa Insights.
- Multi-Location Performance Comparison
For retail chains with locations distributed within regions, Signa Insights has a location-based analysis availability:
– Compare sell-through rates among stores
– Determine regional demand trends for your marketing campaigns
– Adjust warehousing and distribution logistics to match local buying habits
This will lower guesswork and establish harmony between the overall warehouse and distributed branches.
- Dynamic Dashboards and Custom Reports
The Signa Insights dashboards are drag-and-drop dashboards that will tailor to the appropriate role of users from the store managers to C-level staff.
– Visualize dashboard KPIs:
– Inventory Turnover Ratio (ITR)
– Days of Stock Remaining (DSR)
– Gross Margin Return on Inventory (GMROI)
– Shinkage, Waste, and Returns
Reports loaded with visuals including interactive charts, heat maps, and trend lines can represent complex information and reveal simple visuals that can be acted upon.
The Business Impact: From Data to Decisions:
Retailers using Signa Insights Dashboard have noted dramatic operational improvement. Let’s explore the impact:
- Higher Inventory Turns
When stock levels are allocated to actual demands, the retailers have stagnating inventory levels and replenished capital available for re-investment or growth. The Dashboard will allow retailers to maintain healthy turnover ratios,Reduced Stockouts Lead to Increased Sales
Real-time visibility and automatic reorder alerts will significantly reduce lost sales due to out-of-stock. Customers receive consistently available products — growing trust and loyalty.
- Reduced Wastage and Dead Stock
Management realizes item aging and sales velocity to see which products are near the end of life or markdown. Retailers run promotions to liquidate stock to recoup their investment and minimize write-offs.
- Data-Driven Business Approach
With AI-based analytics, the management team can make data-driven decisions about product mix, pricing, and distribution based on facts, not assumptions.
- Real Example
Think of a national retail chain with management over 120 stores. Prior to implementing Signa Insights, the company relied on weekly Excel reports. Stock-outs were a regular occurrence and over-stock in slow-moving locations negatively affected profits. After implementing SignaTech’s retail inventory optimization dashboard:
- Inventory turns grew by 22% within the first 6 months.
- Stock-outs were reduced by 35%.
- Management received real-time alerts and significantly reduced human error.
- Procurement cycles were 30% faster with automated purchase triggers.
The result? Happier customers, improved cash-flows, and a culture that felt more data-driven.
Predictively Ready
The retail market will continue to change, however, predictive analytics and AI will become the backbone of inventory management. The Signa Insights Dashboard already has machine learning models that are constantly reviewing patterns of sales and supply, to help predict demand more accurately over time. The dashboard also easily integrates with ERP, CRM, or POS, allowing for a seamless digital ecosystem with complete visibility and control.
Empowering Retail Intelligence with SignaTech
Every SKU counts, and the need for an enhanced retail inventory optimization dashboard, such as Signa Insights, will be critical. By incorporating aspects of analytics, automation, and AI technologies, it allows retail chains to increase inventory turns, reduce stock-outs and increase profitability across every location in the chain.
With SignaTech’s Signa Insights Dashboard, you are able to not just manage your business but own it.