Wisconsin has long been recognised as one of America’s strongest manufacturing hubs. From heavy machinery and automotive components to food processing and precision equipment, the state’s manufacturing ecosystem plays a vital role in the national economy. However, despite advanced machinery and skilled labour, many manufacturers across Wisconsin continue to face a common challenge: production delays.
Late deliveries, unexpected downtime, inventory shortages, quality issues, and inefficient workflows can quietly drain profitability. In today’s highly competitive market, even small delays can result in lost contracts, dissatisfied customers, and damaged brand reputation.
This is where a Manufacturing Analytics Dashboard for Wisconsin becomes an essential tool for modern factories. By providing real-time insights, predictive analysis, and centralised performance monitoring, analytics dashboards help manufacturers regain control over their operations.
Understanding the Root Causes of Production Delays
Production delays rarely happen overnight. They are usually the result of multiple small issues building up over time. Without proper visibility, these issues remain hidden until they become major operational problems.
Some of the most common causes include:
1. Unplanned Equipment Downtime
Machinery breakdowns remain one of the biggest contributors to lost production hours. Without predictive monitoring, maintenance teams often react only after failures occur.
2. Inefficient Scheduling
Poor production planning leads to idle machines, overloaded shifts, and missed delivery timelines.
3. Inventory Imbalances
Running out of raw materials or overstocking finished goods disrupts production flow and increases storage costs.
4. Manual Data Collection
Many factories still rely on spreadsheets and handwritten reports, which are prone to errors and delays.
5. Lack of Process Visibility
Without centralised dashboards, managers struggle to see bottlenecks forming in real time.
6. Workforce Productivity Issues
Absenteeism, skill gaps, and uneven workload distribution reduce operational efficiency.
These problems may seem manageable. Together, they create systemic inefficiencies that slow down production.
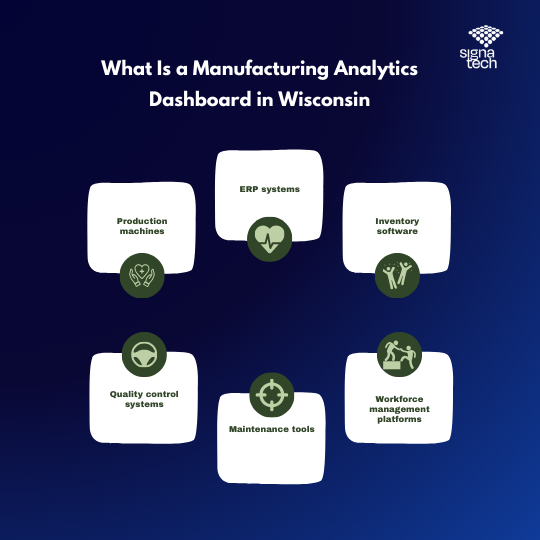
What Is a Manufacturing Analytics Dashboard in Wisconsin?
A Manufacturing Analytics Dashboard for Wisconsin is a digital platform that collects data from multiple sources within a factory and presents it in an easy-to-understand visual format.
These dashboards integrate information from:
- Production machines
- ERP systems
- Inventory software
- Quality control systems
- Maintenance tools
- Workforce management platforms
Instead of reviewing disconnected reports, managers access a unified view of operations through charts, graphs, KPIs, and real-time alerts.
This transforms raw data into actionable intelligence.
How Manufacturing Analytics Dashboards Reduce Production Delays
1. Real-Time Production Tracking
Analytics dashboards provide live updates on:
- Units produced per shift
- Machine utilisation rates
- Order completion status
- Cycle times
- Production speed
Managers can instantly identify slowdowns and intervene before deadlines are missed.
2. Predictive Maintenance Management
By analysing historical machine data, dashboards predict potential equipment failures. Maintenance teams can schedule repairs in advance, reducing costly downtime.
This proactive approach prevents unexpected stoppages and extends equipment lifespan.
3. Bottleneck Identification
Dashboards highlight production stages where delays occur frequently. Whether it’s packaging, inspection, or assembly, bottlenecks become visible immediately.
Once identified, resources can be reallocated to balance workflows.
4. Inventory Optimisation
Real-time inventory tracking ensures:
- Raw materials are available when needed
- Overstocking is minimised
- Reordering is automated
- Storage costs are reduced
This keeps production running without interruptions.
5. Quality Control Monitoring
Defective products slow down operations and increase rework costs. Analytics dashboards track:
- Defect rates
- Inspection failures
- Rejection trends
- Root causes
Early detection improves product quality and reduces delays.
6. Workforce Performance Analysis
Managers can monitor:
- Productivity per operator
- Shift performance
- Training needs
- Attendance patterns
This enables better workforce planning and reduces human-related delays.
Why Wisconsin Manufacturers Must Adopt Analytics Now
Wisconsin’s manufacturing sector is becoming increasingly competitive. With rising labour costs, global competition, and customer expectations for faster delivery, operational efficiency is critical.
A Manufacturing Analytics Dashboard for Wisconsin helps businesses stay ahead by enabling:
Faster Decision-Making
Data-driven insights replace assumptions and guesswork.
Improved Customer Satisfaction
On-time delivery improves trust and repeat business.
Cost Reduction
Optimised operations lower energy, labour, and maintenance expenses.
Regulatory Compliance
Automated reporting simplifies audits and documentation.
Digital Transformation Readiness
Analytics platforms support Industry 4.0 initiatives.
Manufacturers that delay digital adoption risk falling behind more technologically advanced competitors.
Moving from Traditional Reporting to Smart Analytics
Traditional manufacturing reports are static and backwards-looking. They tell you what went wrong after the damage is done.
In contrast, analytics dashboards are:
- Dynamic
- Real-time
- Predictive
- Interactive
- Action-oriented
They enable factories to move from reactive management to proactive leadership.
With real-time alerts and performance thresholds, managers are notified immediately when KPIs deviate from targets.
Key Features of an Effective Manufacturing Analytics Dashboard in Wisconsin
A high-quality analytics dashboard should include:
1. Customisable KPIs
Different factories have different priorities. Dashboards must adapt to business goals.
2. Multi-Device Accessibility
Access data from desktops, tablets, and mobile devices.
3. Secure Data Management
Advanced encryption and role-based access protect sensitive information.
4. System Integration
Seamless connection with ERP, MES, CRM, and IoT systems.
5. Scalable Architecture
The system should grow with your business.
6. User-Friendly Interface
Simple navigation ensures adoption across departments.
Implementation Challenges and How to Overcome Them
Some manufacturers hesitate to adopt analytics systems due to perceived challenges.
Common Concerns:
- High implementation cost
- Data integration complexity
- Staff resistance
- Training requirements
- Cybersecurity risks
Practical Solutions:
Start with pilot projects
Use modular implementations
Provide employee training
Partner with experienced developers
Follow cybersecurity best practices
With the right strategy, implementation becomes smooth and cost-effective.
Real Business Impact: What Manufacturers Experience
After implementing a Manufacturing Analytics Dashboard in Wisconsin, many factories report:
- 20–35% reduction in downtime
- 15–25% improvement in productivity
- 30% faster reporting cycles
- 10–20% cost savings
- Higher employee accountability
These improvements translate directly into increased profitability and market competitiveness.
The Role of Customisation in Analytics Solutions
Every manufacturing facility is unique. A generic dashboard may not reflect your workflows.
Customised dashboards ensure:
- Relevant KPIs
- Industry-specific metrics
- Tailored reporting
- Process-aligned insights
Customisation maximises ROI and user adoption.
Future of Manufacturing in Wisconsin: Data-Driven Excellence
The future of manufacturing lies in:
- Smart factories
- IoT integration
- AI-powered analytics
- Predictive optimisation
- Autonomous systems
A Manufacturing Analytics Dashboard in Wisconsin forms the foundation for these advanced technologies.
Businesses that adopt analytics today are better prepared for tomorrow’s innovations.
Partner with SignaTech for Smarter Manufacturing
Production delays are not just operational issues; they are strategic risks. In a fast-paced manufacturing environment, real-time visibility and data-driven decision-making are essential for sustainable success.
Implementing a Manufacturing Analytics Dashboard for Wisconsin enables manufacturers to eliminate bottlenecks, improve efficiency, reduce costs, and enhance customer satisfaction.
At SignaTech, we specialise in designing and developing customised manufacturing analytics dashboards tailored to your operational needs. Our solutions integrate seamlessly with your existing systems and deliver actionable insights that drive measurable results.
Whether you are planning your first analytics system or upgrading your current platform, our team is ready to support your digital transformation journey.
Contact SignaTech today to learn how we can help you build a smarter, faster, and more profitable manufacturing operation.
Let’s transform your data into your strongest competitive advantage.